The ED-IPC1220 provides industrial digital inputs and sinking outputs through its terminal blocks, with the corresponding signals accessible through Linux GPIO interfaces. I used GPIO12 for DO0 and GPIO17 for DI0, then followed the signals beyond the command line with an oscilloscope and edge-event logs.
I accessed the computer over Wi-Fi with SSH. The bench setup included a Digilent Analog Discovery 2 running WaveForms, an Allosun EM830 multimeter, jumper wiring, and the Analog Discovery’s 5 V supply. DO0 used external 5 kΩ and approximately 1 kΩ pull-ups; DI0 received a 0–5 V square wave from Wavegen W1 referenced to COMA.
These measurements describe this review setup at 5 V. They do not establish the ED-IPC1220’s maximum industrial switching specifications.
Starting at the terminal
Verifying DO0 control from Linux
EDATEC documents pinctrl as the direct way to manipulate the Raspberry Pi GPIOs. I first configured GPIO12 as an output and changed its state manually:
pinctrl set 12 op dh
pinctrl get 12

pinctrl set 12 op dl
pinctrl get 12
The Analog Discovery 2 confirmed that the voltage at DO0 changed as the GPIO state was toggled. Because DO0 is a sinking output, the external pull-up brings the terminal HIGH when the output stage is inactive, while the active output pulls it LOW. A simple shell loop produced a slow square wave. Because each state was held for two seconds, one complete cycle took approximately four seconds, corresponding to about 0.25 Hz:
while true; do
    pinctrl set 12 op dh
    sleep 2
    pinctrl set 12 op dl
    sleep 2
done
Digilent Analog Discovery 2
5 V Supply (V+)
|
|
[ R_PULLUP ]
5 kΩ or 1 kΩ
|
+-------------------- Scope CH1+
| (1+)
|
+-------------------- EDATEC DO0
|
|
Documented sinking
output (conceptual)
|
|
AD2 GND ---------------------- EDATEC COMB
|
|
+-------------------- Scope CH1-
(1-)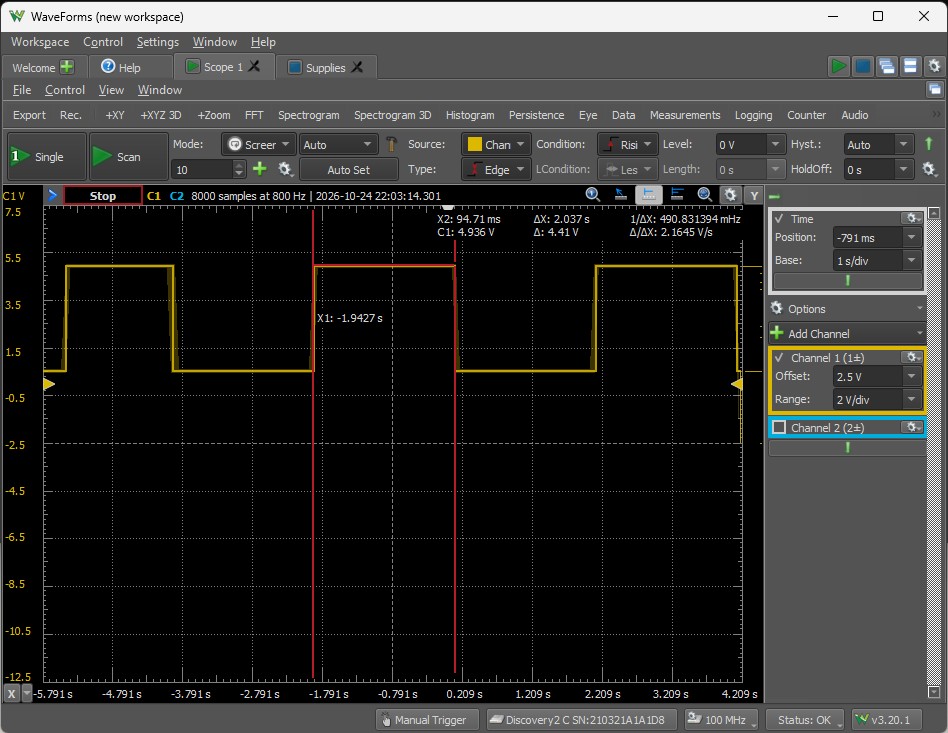
I then automated the same approach in Python. The script repeatedly launched pinctrl as a subprocess, changed the line state, and delayed for the requested half-period. It worked, but the measured frequency increasingly fell below the requested value.
| Requested frequency | Measured frequency | Shortfall |
|---|---|---|
| 10 Hz | 8.788 Hz | 12.1% |
| 25 Hz | 18.915 Hz | 24.3% |
| 50 Hz | 30.725 Hz | 38.6% |
The frequency shortfall was consistent with the overhead of launching a separate pinctrl process for every transition, together with Python execution and Linux scheduling delays. These figures characterize that implementation, not the intrinsic switching limit of DO0.
Removing process-launch overhead
Improving switching accuracy with libgpiod
I inspected the available GPIO character devices with ls -l /dev/gpiochip*, gpioinfo, and gpioset --version. The system exposed three GPIO chips and a compatibility link from /dev/gpiochip4 to /dev/gpiochip0. GPIO12 appeared as line 12 on gpiochip0, and the installed libgpiod version was 2.2.1 with working Python bindings.
The revised Python test requested GPIO12 once and toggled the existing line request instead of starting pinctrl for every edge. That change brought the measured frequencies much closer to their targets.
| Requested | Measured with libgpiod | Difference |
|---|---|---|
| 25 Hz | 25.041 Hz | +0.16% |
| 50 Hz | 49.373 Hz | −1.25% |
| 100 Hz | 97.499 Hz | −2.50% |
| 150 Hz | 144.58 Hz | −3.61% |
| 200 Hz | 190.62 Hz | −4.69% |
| 250 Hz | 235.49 Hz | −5.80% |
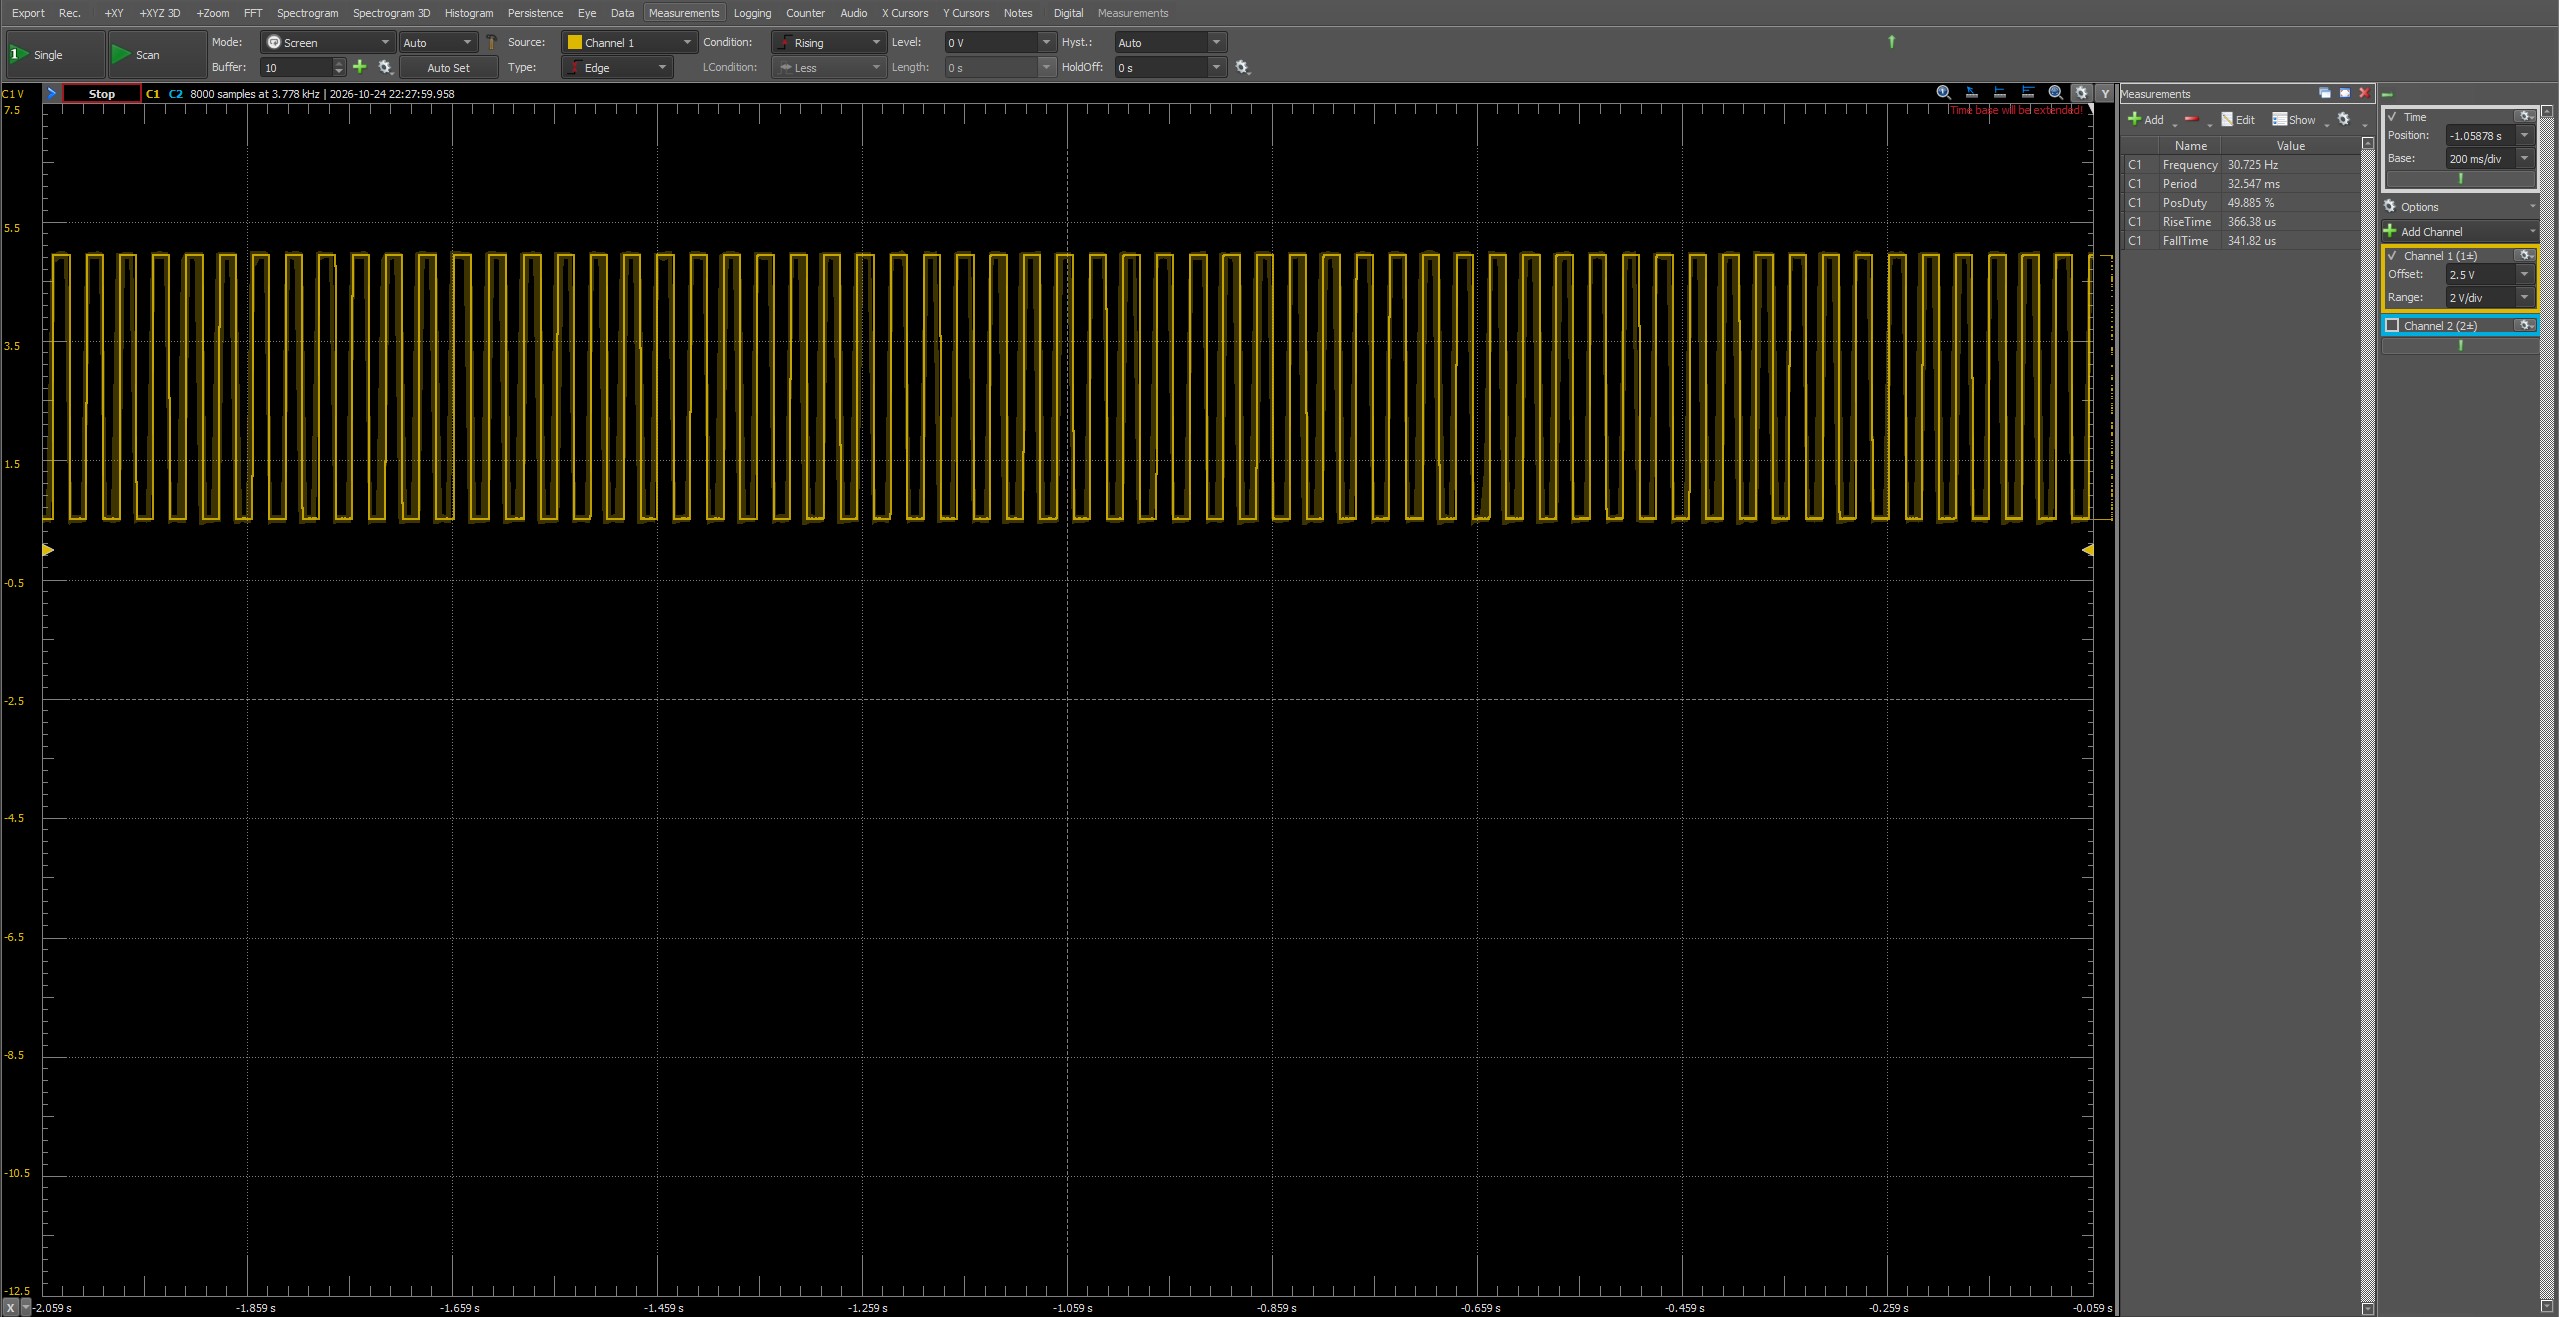
Requested: 50 Hz · Measured: 30.725 Hz
Timebase: 200 ms/div
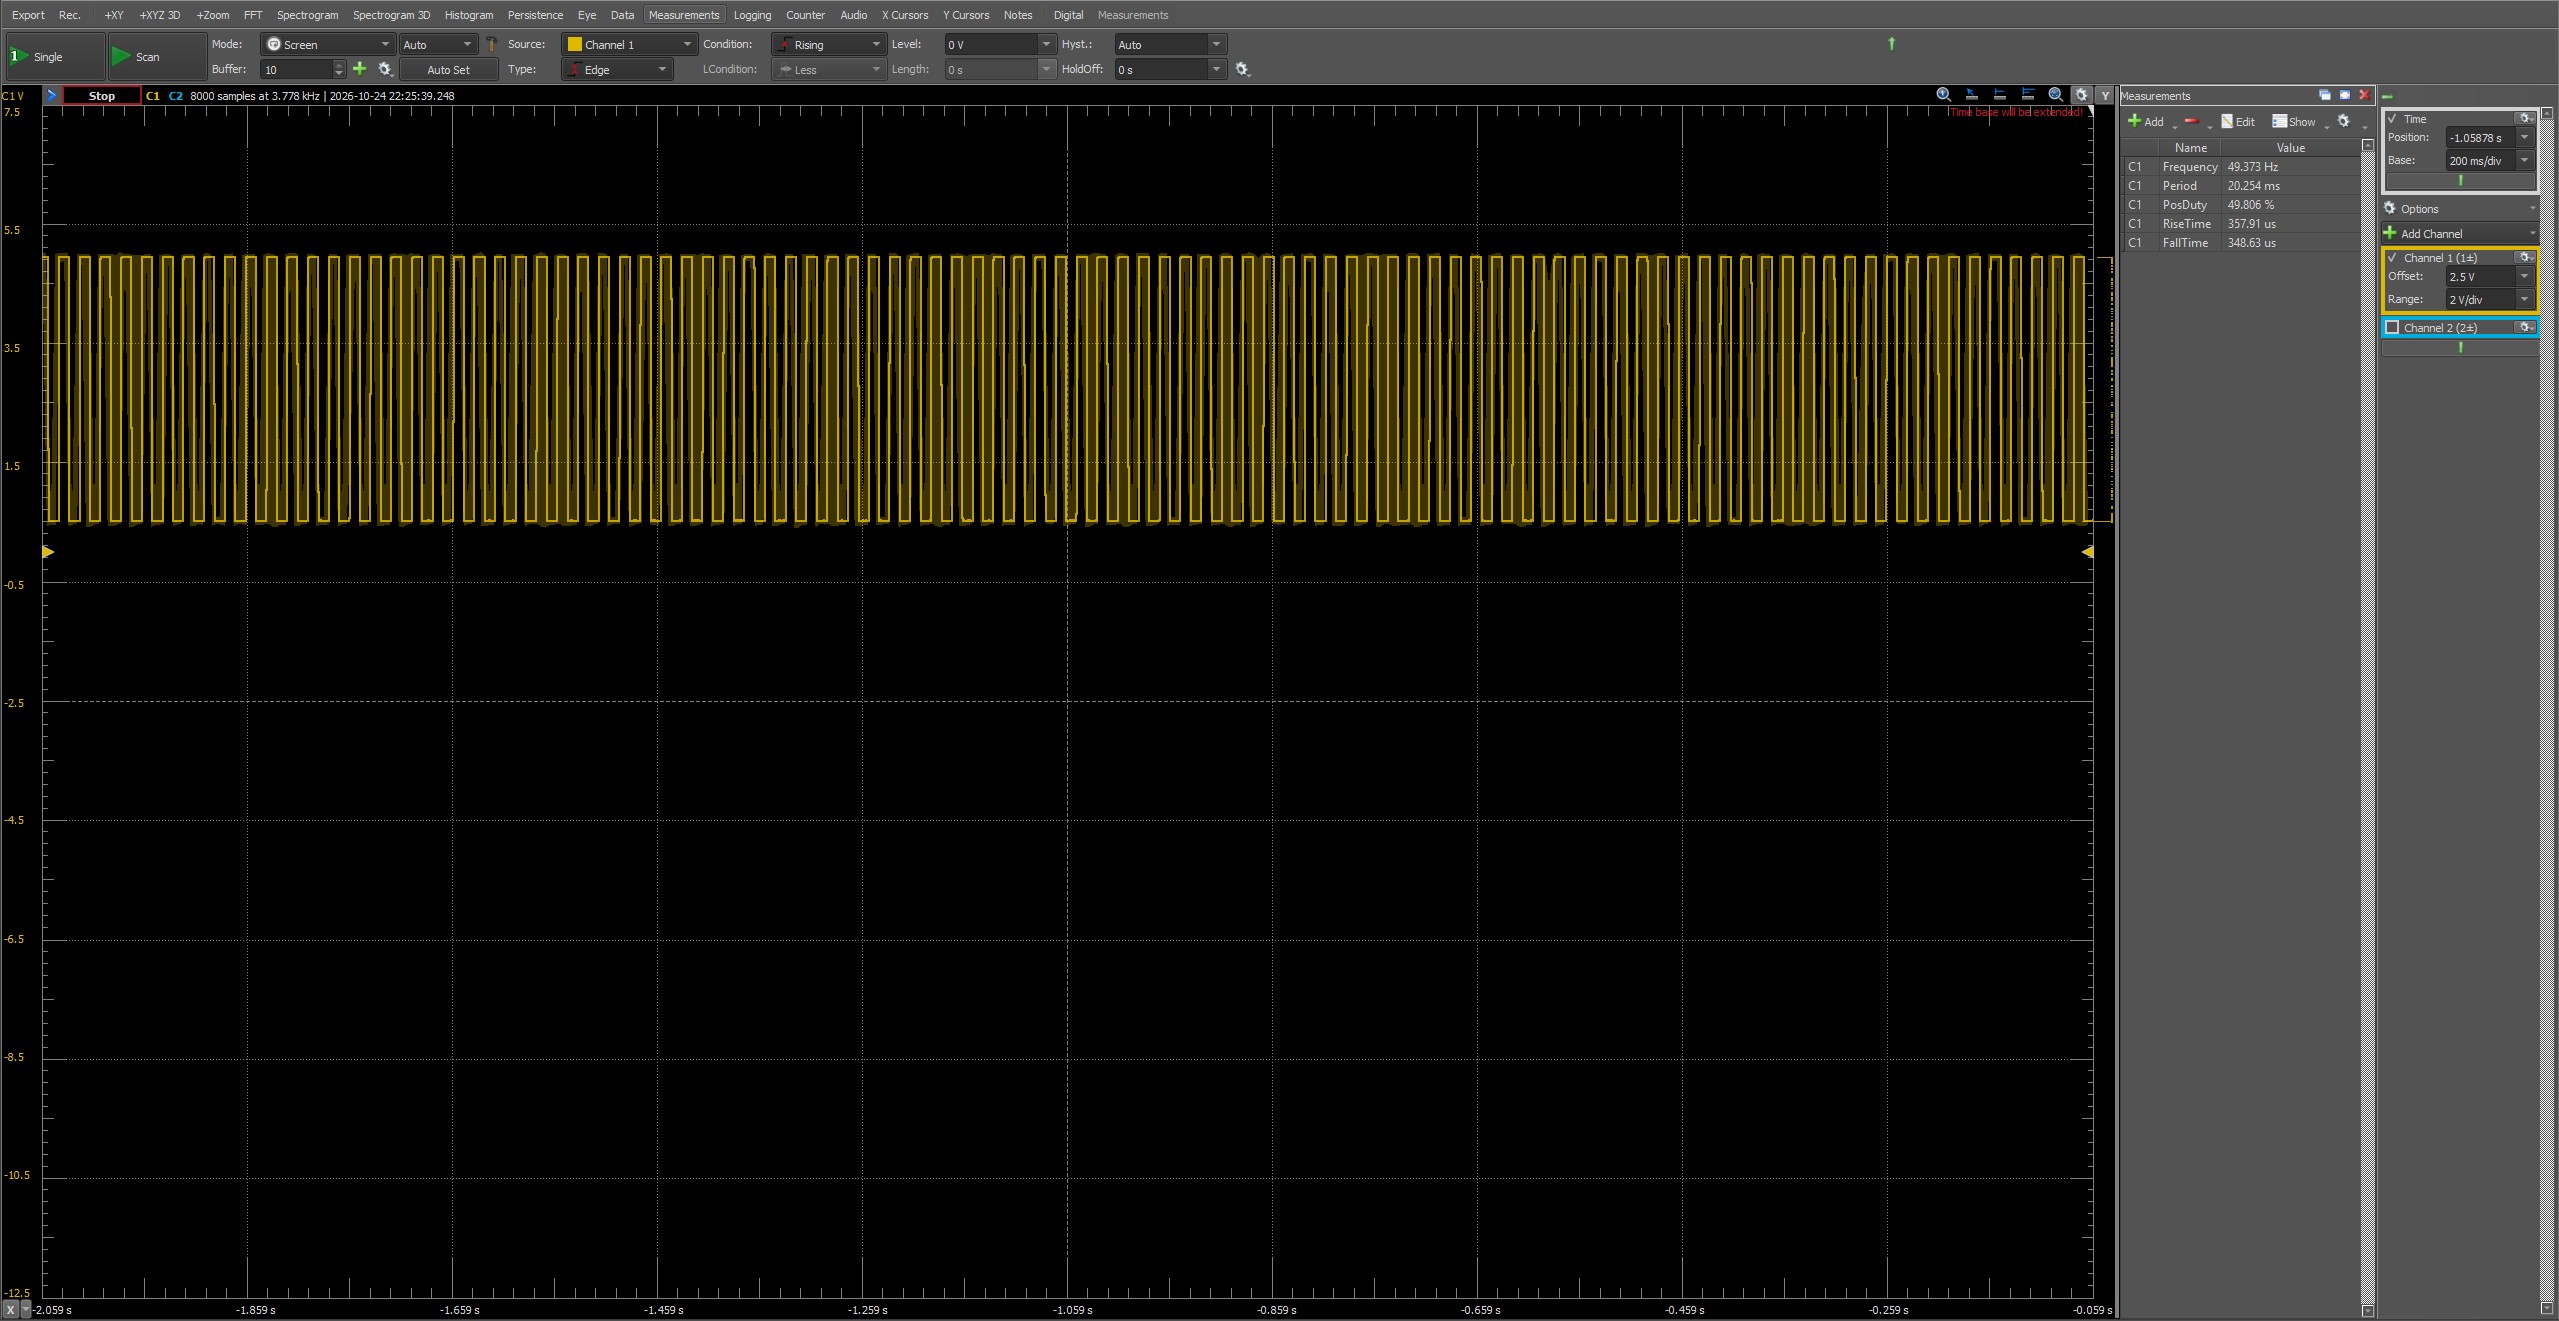
Requested: 50 Hz · Measured: 49.373 Hz
Timebase: 200 ms/div
DO0 output at a requested 50 Hz: repeated pinctrl subprocess calls (left) versus a persistent libgpiod request (right). Both captures use the same 200 ms/div timebase; open either image to inspect the original WaveForms measurements.
By keeping the GPIO line requested throughout the test, the revised implementation reduced the frequency error from approximately 38.6% to 1.25% at a requested 50 Hz.
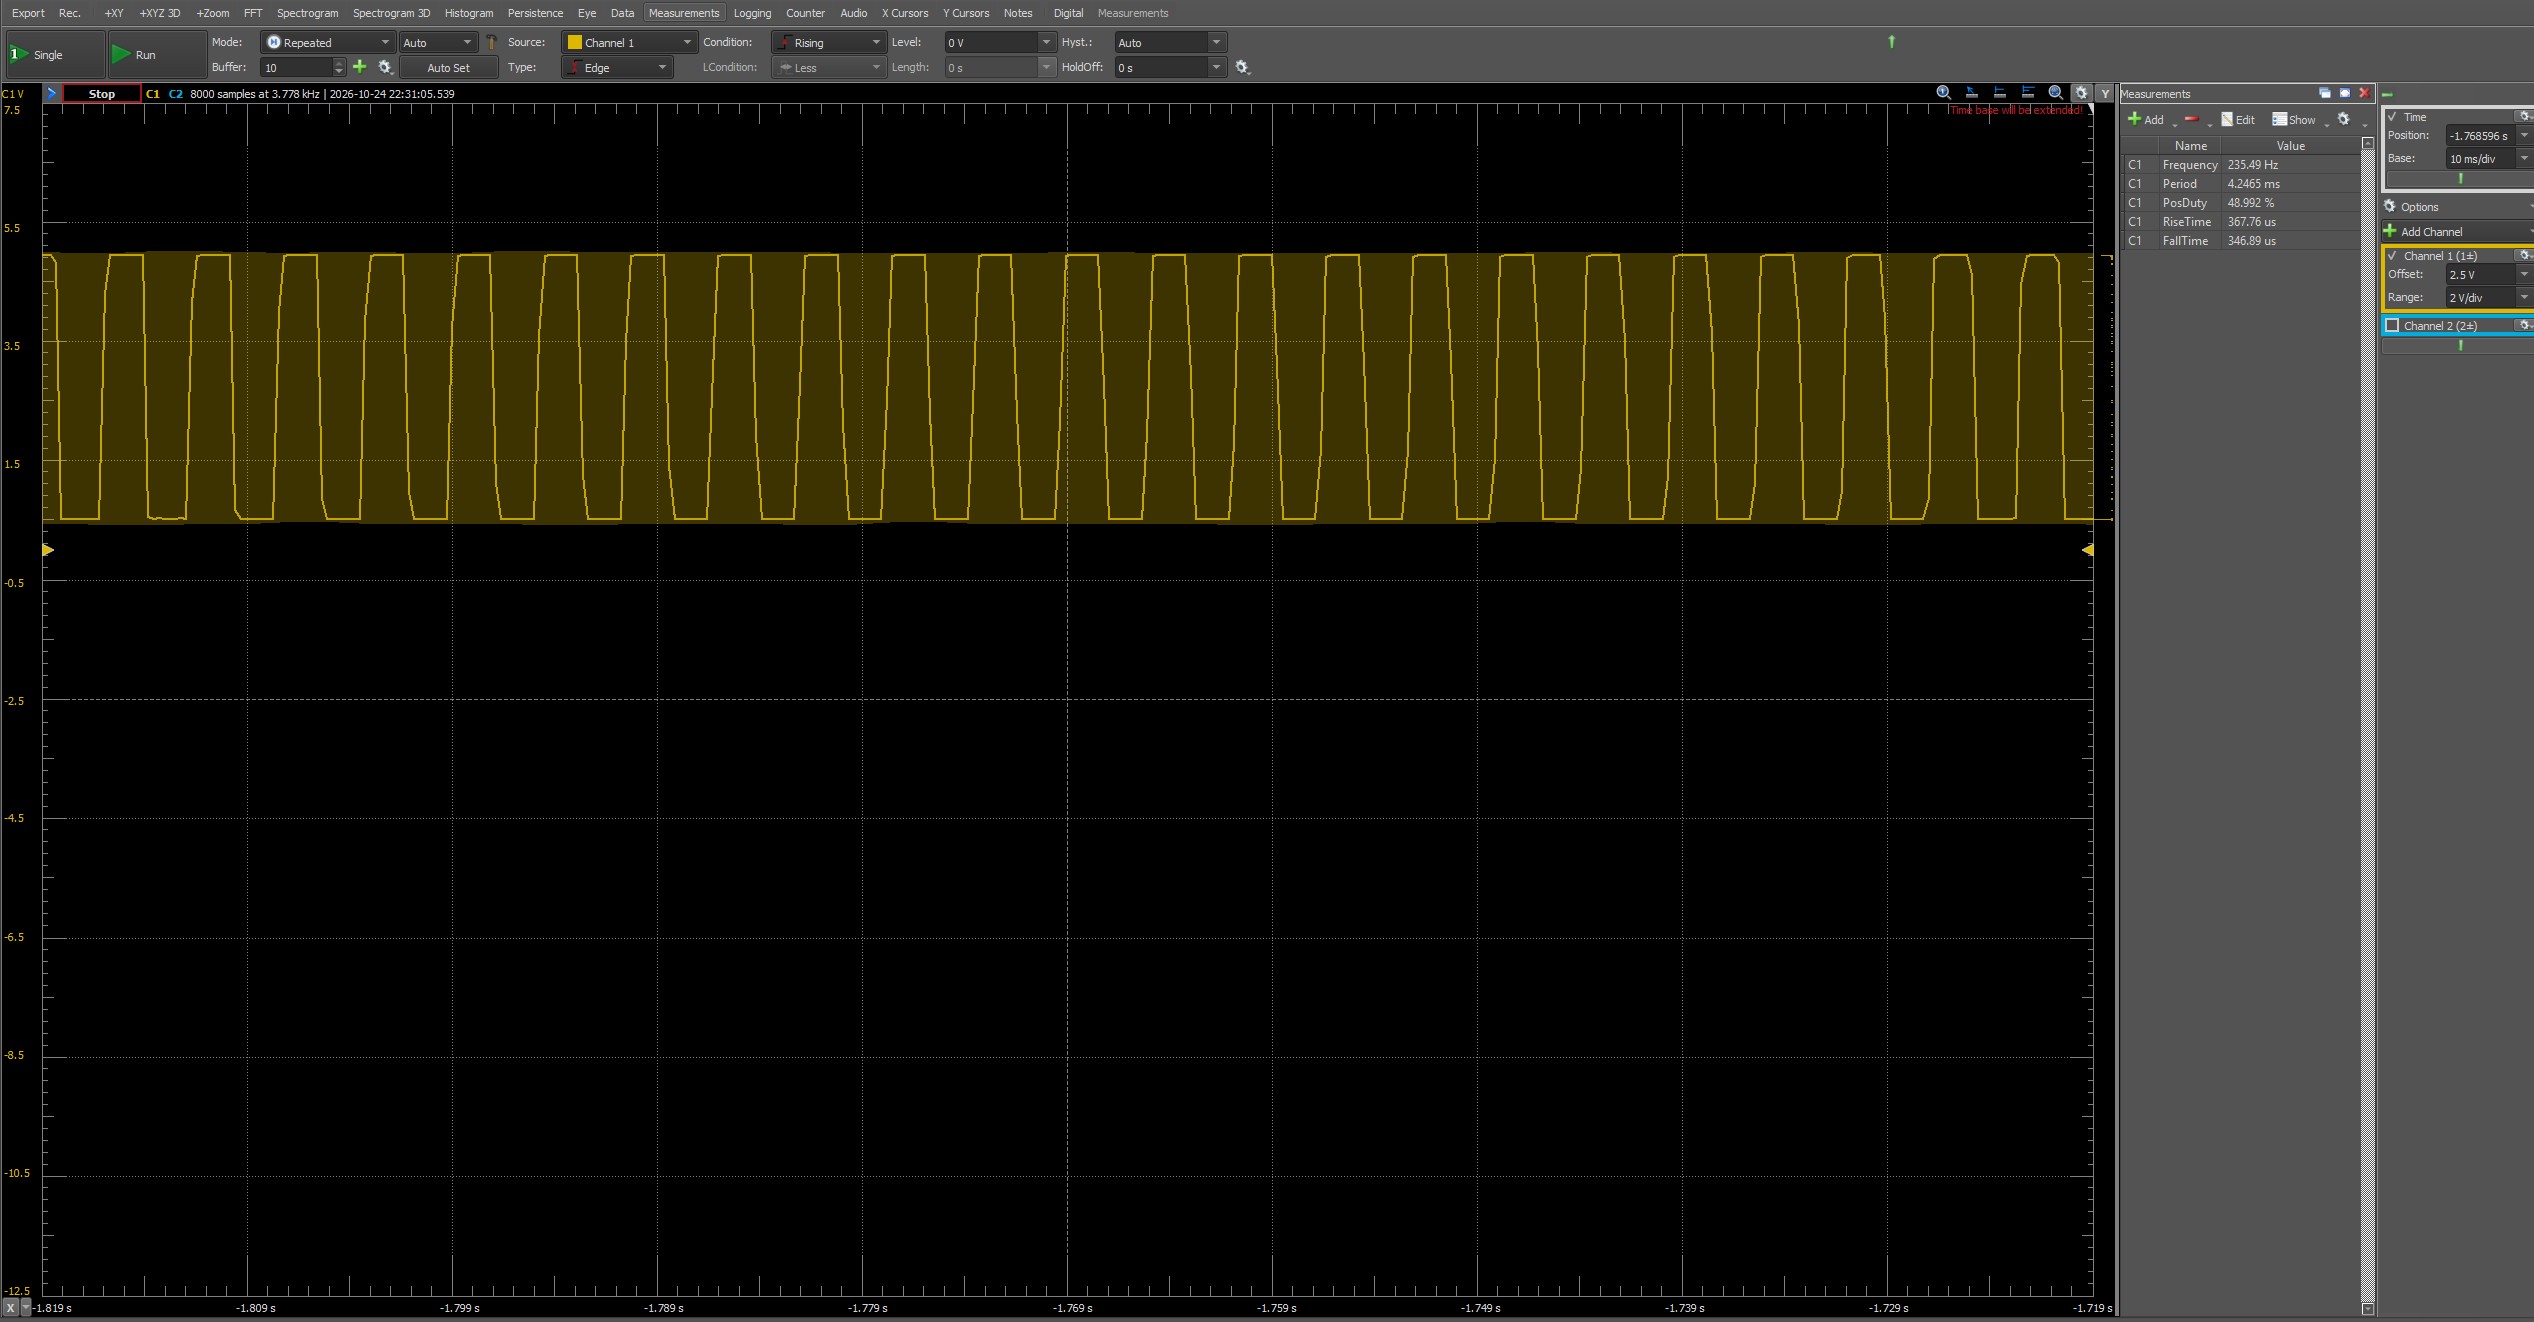
Electrical behavior and consistency
The pull-up affected the rising edge far more than the falling edge
DO0 is a sinking output, so the external resistor pulls the signal HIGH while the output stage actively pulls it LOW. I captured the transitions at approximately 33.333 MS/s, first with a 5 kΩ pull-up to 5 V and then with two 500 Ω resistors in series for approximately 1 kΩ.
| Pull-up | Rise time | Fall time |
|---|---|---|
| 5 kΩ | About 40.6 µs | 0.704 µs |
| Approximately 1 kΩ | 30.038 µs | 0.623 µs |
Reducing the pull-up resistance shortened the measured rise time by approximately 26%, while the already-fast falling edge changed much less. That behavior is consistent with a sinking output and an external pull-up. These measurements show the effect of changing the pull-up resistance, without identifying the behavior of each internal circuit component.
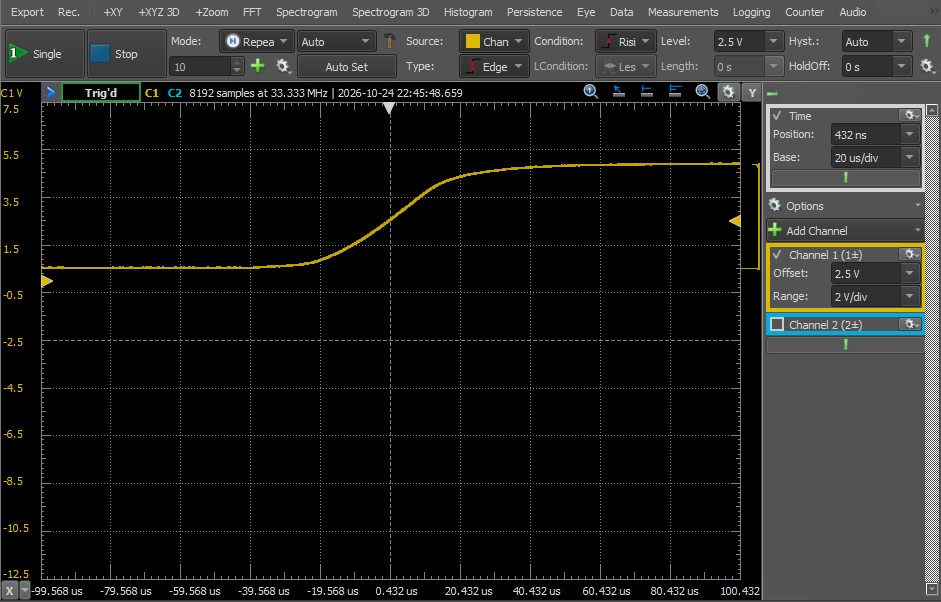
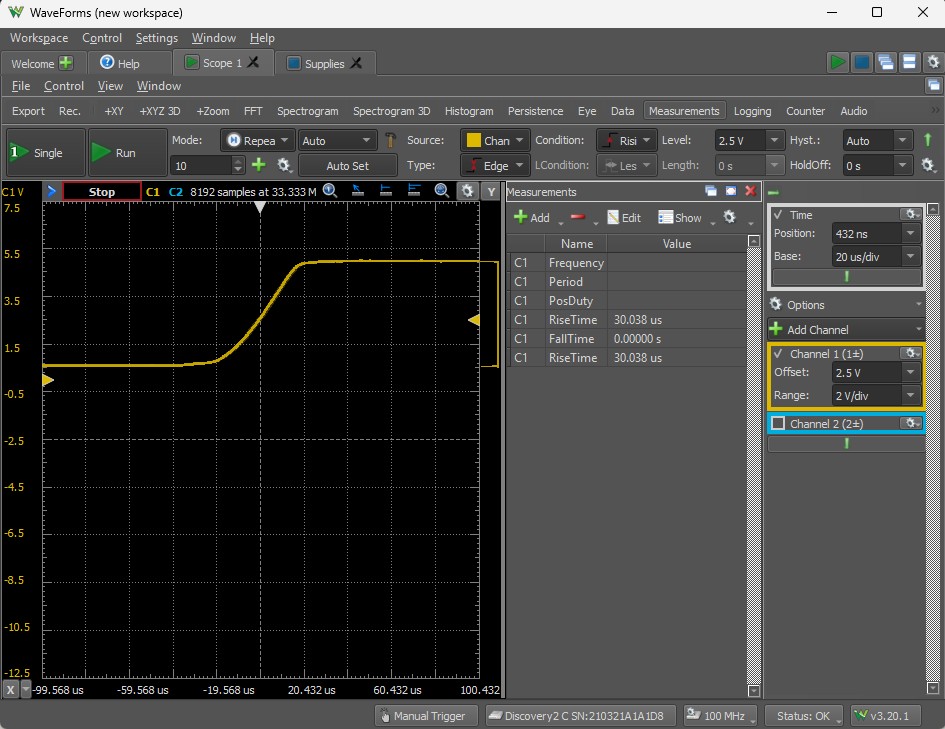
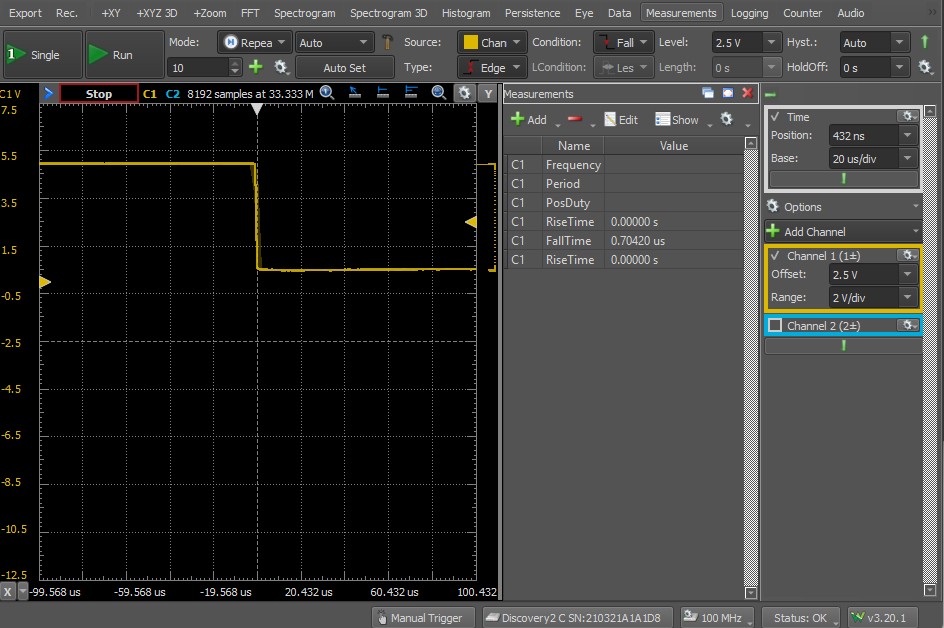
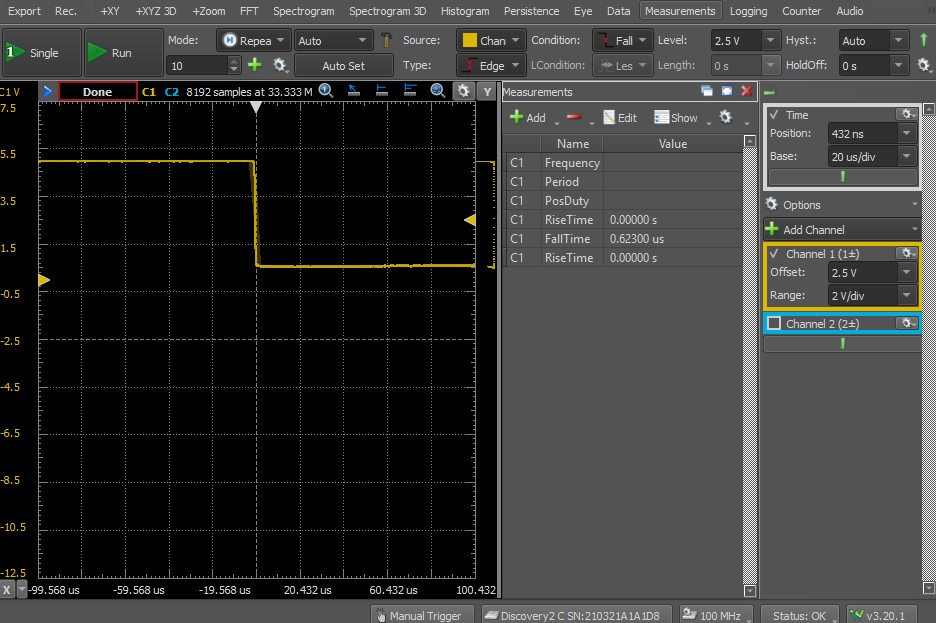
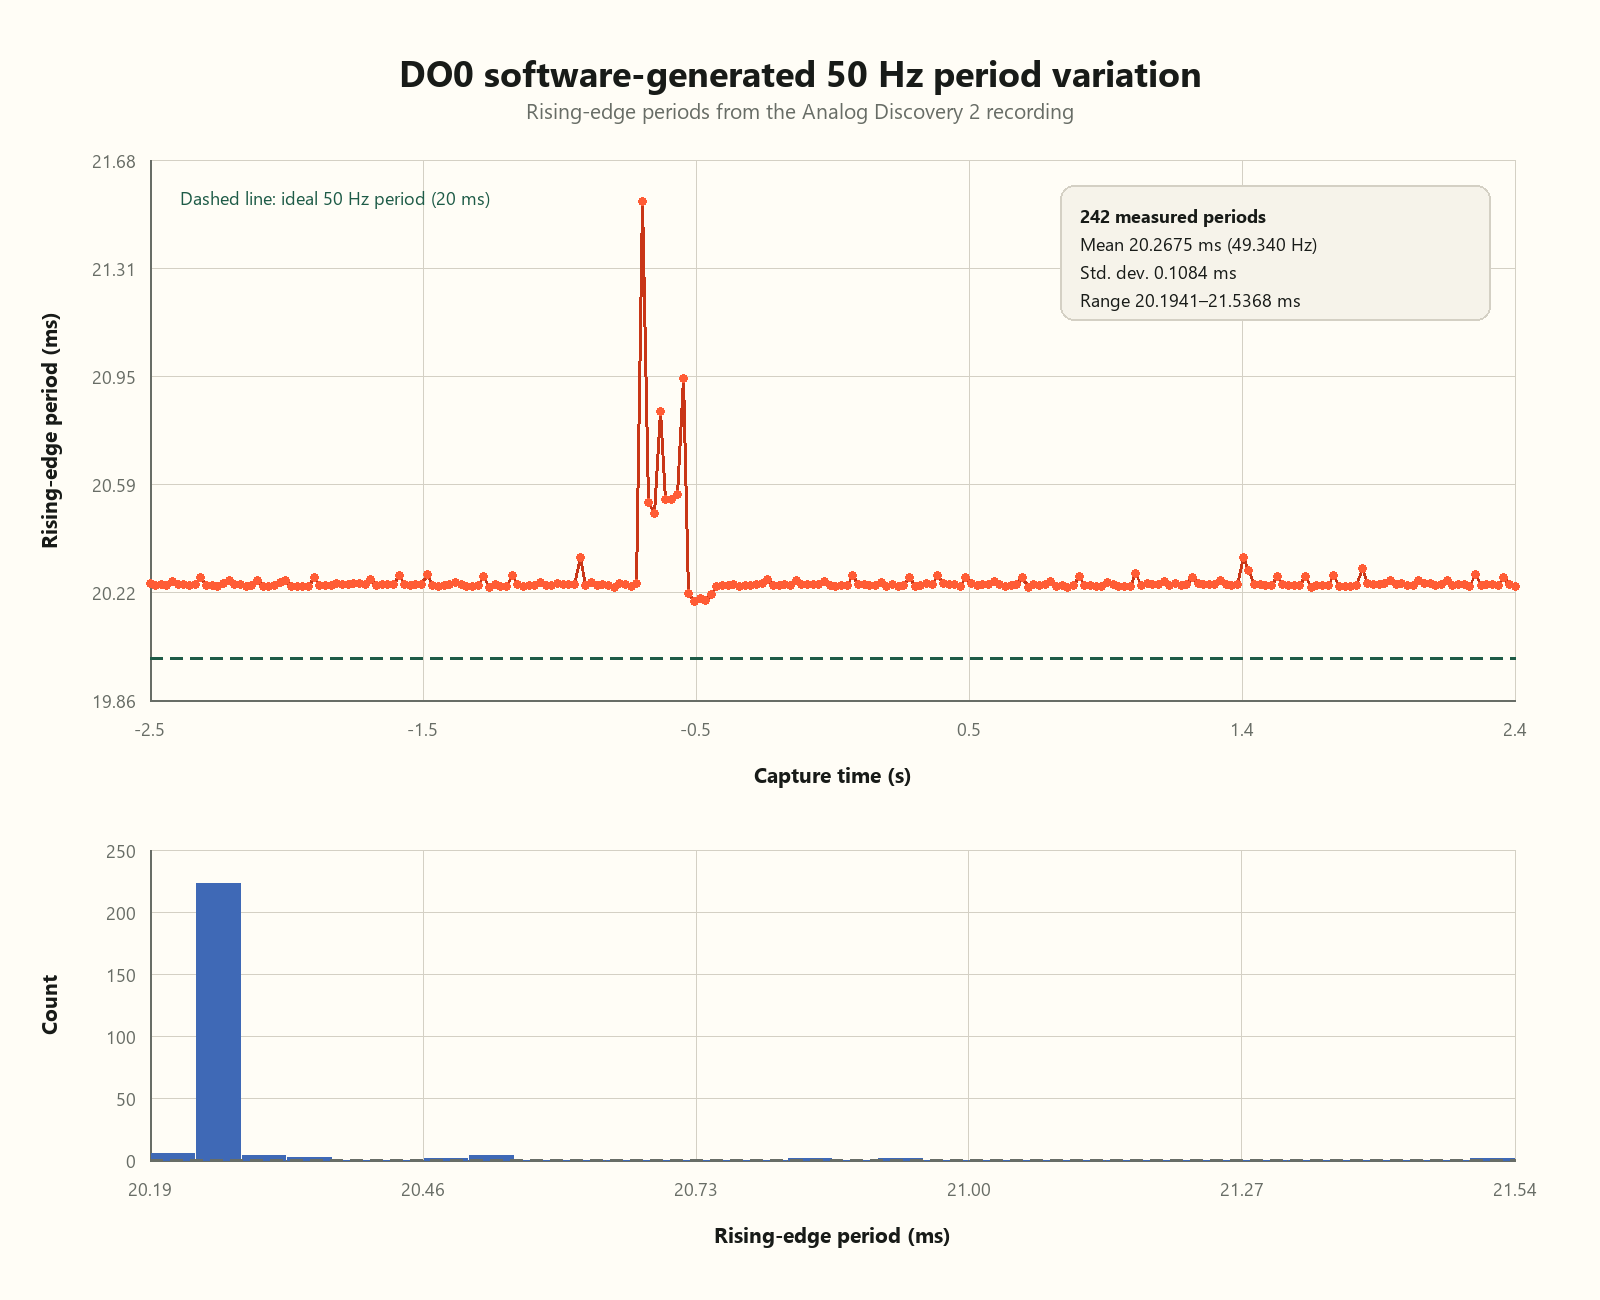
In a separate five-second recording of the requested 50 Hz output at 100 kS/s, I measured consecutive rising-edge periods. The average period was 20.2675 ms, corresponding to 49.340 Hz, with a standard deviation of 0.1084 ms. Most cycles formed a tight group, but occasional longer periods reached 21.5368 ms.
Moving to the input
DI0 detected a static signal and repetitive waveforms
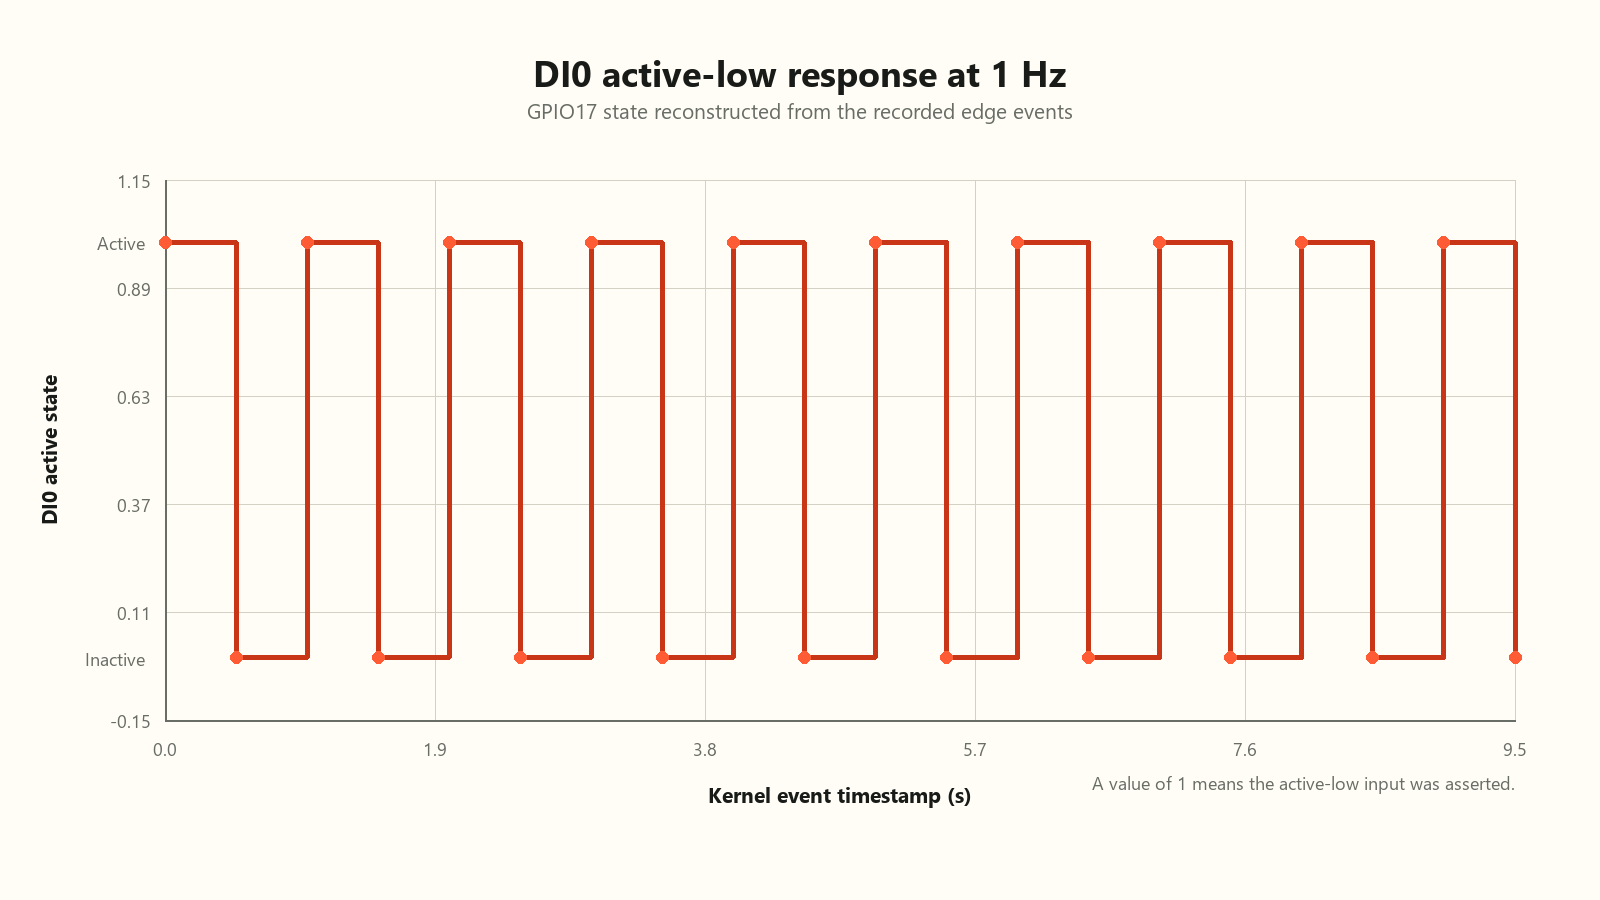
DI0 maps to GPIO17 and uses active-low logic. I first applied a static 5 V signal from the Analog Discovery 2 supply, referenced to COMA, and watched pinctrl get 17. The reported GPIO state changed when I activated and removed the external input. A multimeter in series measured approximately 3.4 mA under these test conditions.
pinctrl get 17
17: ip    -- | hi // GPIO17 = input

pinctrl get 17
17: ip    -- | lo // GPIO17 = input

watch -n 0.1 'pinctrl get 17' Digilent Analog Discovery 2
Waveform Generator (W1)
0–5 V Square Wave
50% Duty Cycle
|
|
+---------------------- EDATEC DI0
|
+---------------------- Scope CH1+
(1+)
AD2 GND -------------------------- EDATEC COMA
|
|
+----------------------------- Scope CH1-
(1-)
EDATEC ED-IPC1220
-----------------
DI0 -> GPIO17 (active-low)
COMA -> Digital input commonFor dynamic tests, Wavegen W1 supplied a 0–5 V square wave to DI0 with its reference connected to COMA. I wrote a libgpiod edge-event logger that recorded the kernel event timestamp, edge type, GPIO level, interpreted active-low state, and sequence number for each transition.
Frequency tracking and duty cycle
DI0 kept count through 250 Hz, but the active interval grew
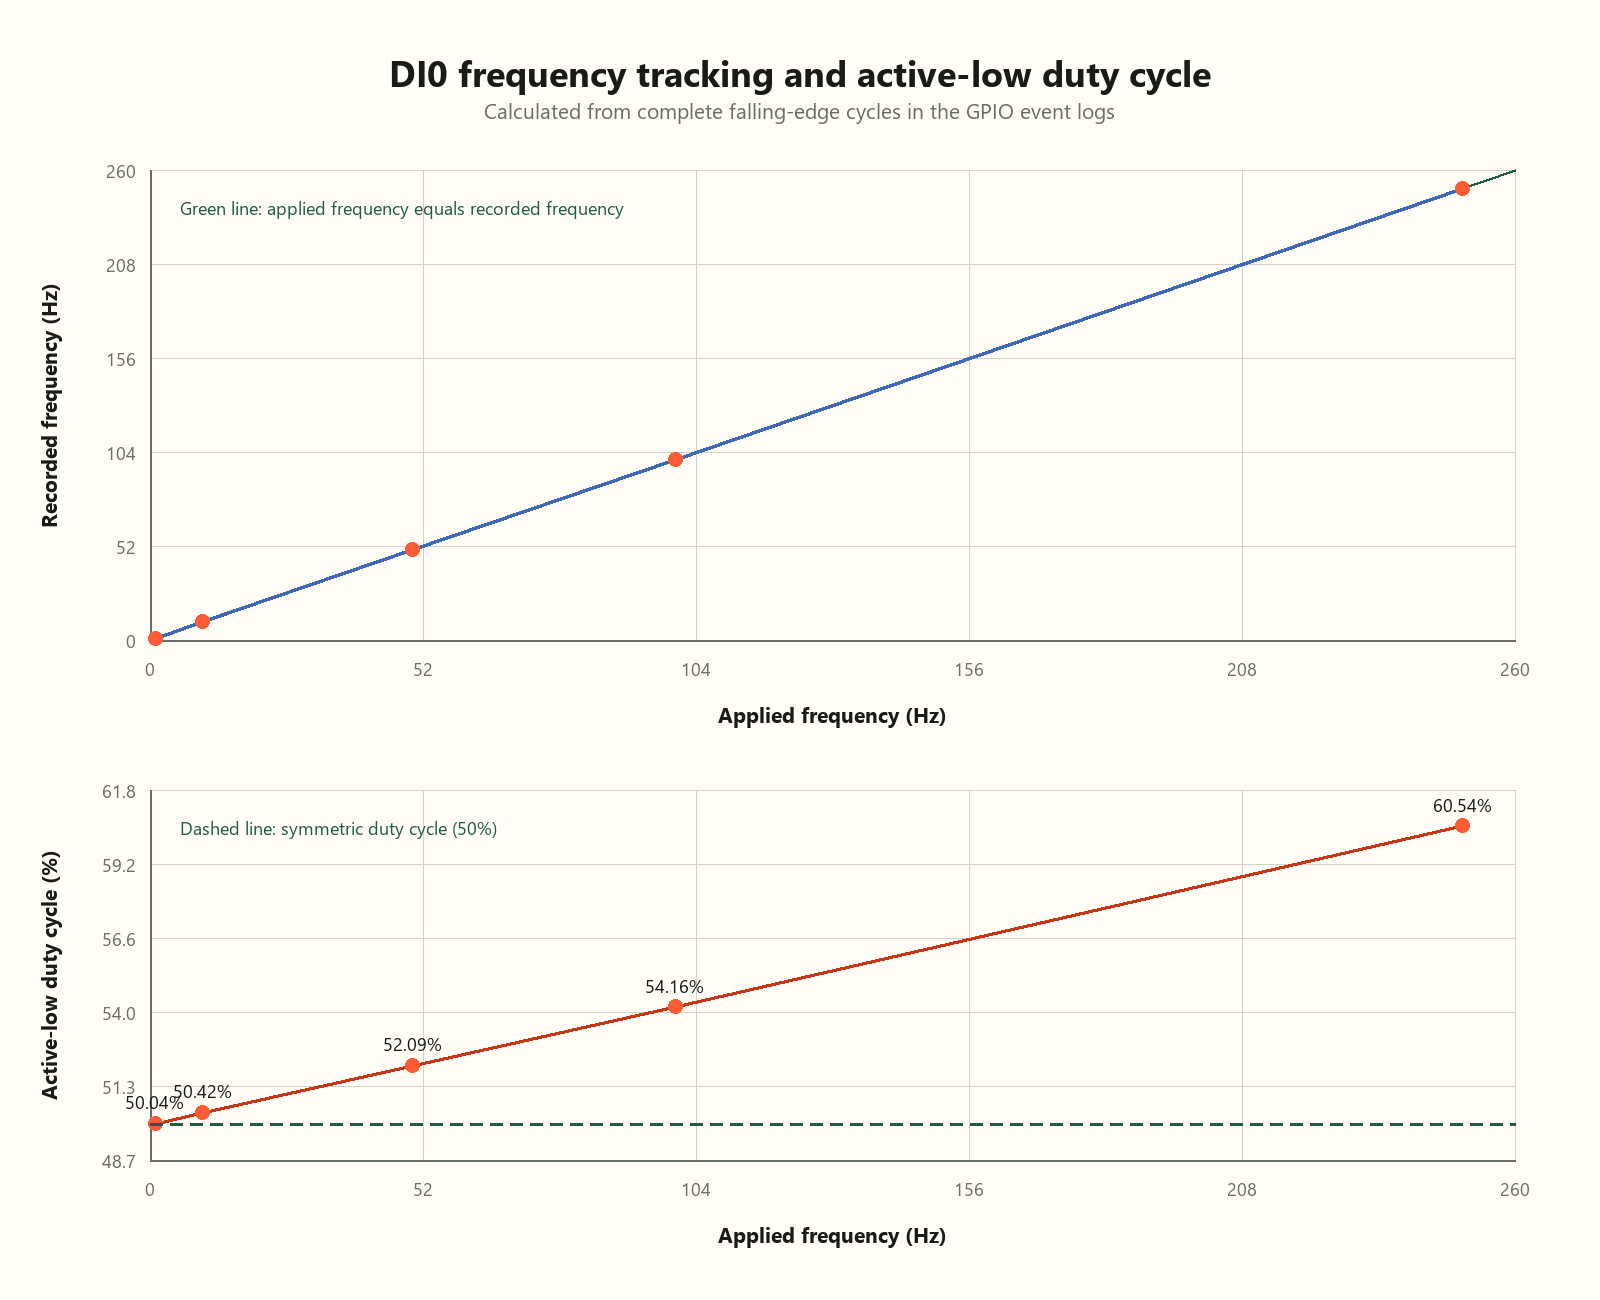
I tested applied frequencies of 1, 10, 50, 100, and 250 Hz. Falling-edge-to-falling-edge periods stayed close to the commanded values. DI0 recorded the expected number of transitions through 250 Hz, and the 250 Hz log contained 5,000 transitions—2,500 rising and 2,500 falling—with no gaps in the GPIO event sequence numbers. The 250 Hz point was simply the highest frequency in this experimental sweep; it does not establish DI0’s maximum detection frequency.
| Applied | Recorded | Period standard deviation | Active-low duty cycle |
|---|---|---|---|
| 1 Hz | 0.99994 Hz | 0.123590 ms | 50.04% |
| 10 Hz | 9.99951 Hz | 0.007114 ms | 50.42% |
| 50 Hz | 49.99779 Hz | 0.002456 ms | 52.09% |
| 100 Hz | 99.99589 Hz | 0.002476 ms | 54.16% |
| 250 Hz | 249.99059 Hz | 0.002253 ms | 60.54% |
The recorded frequency closely followed the applied signal. The duty-cycle result was more interesting: the logged active-low interval increased steadily with frequency, reaching 60.54% at 250 Hz.
The individual cycle periods remained tightly grouped even at the highest test frequency:
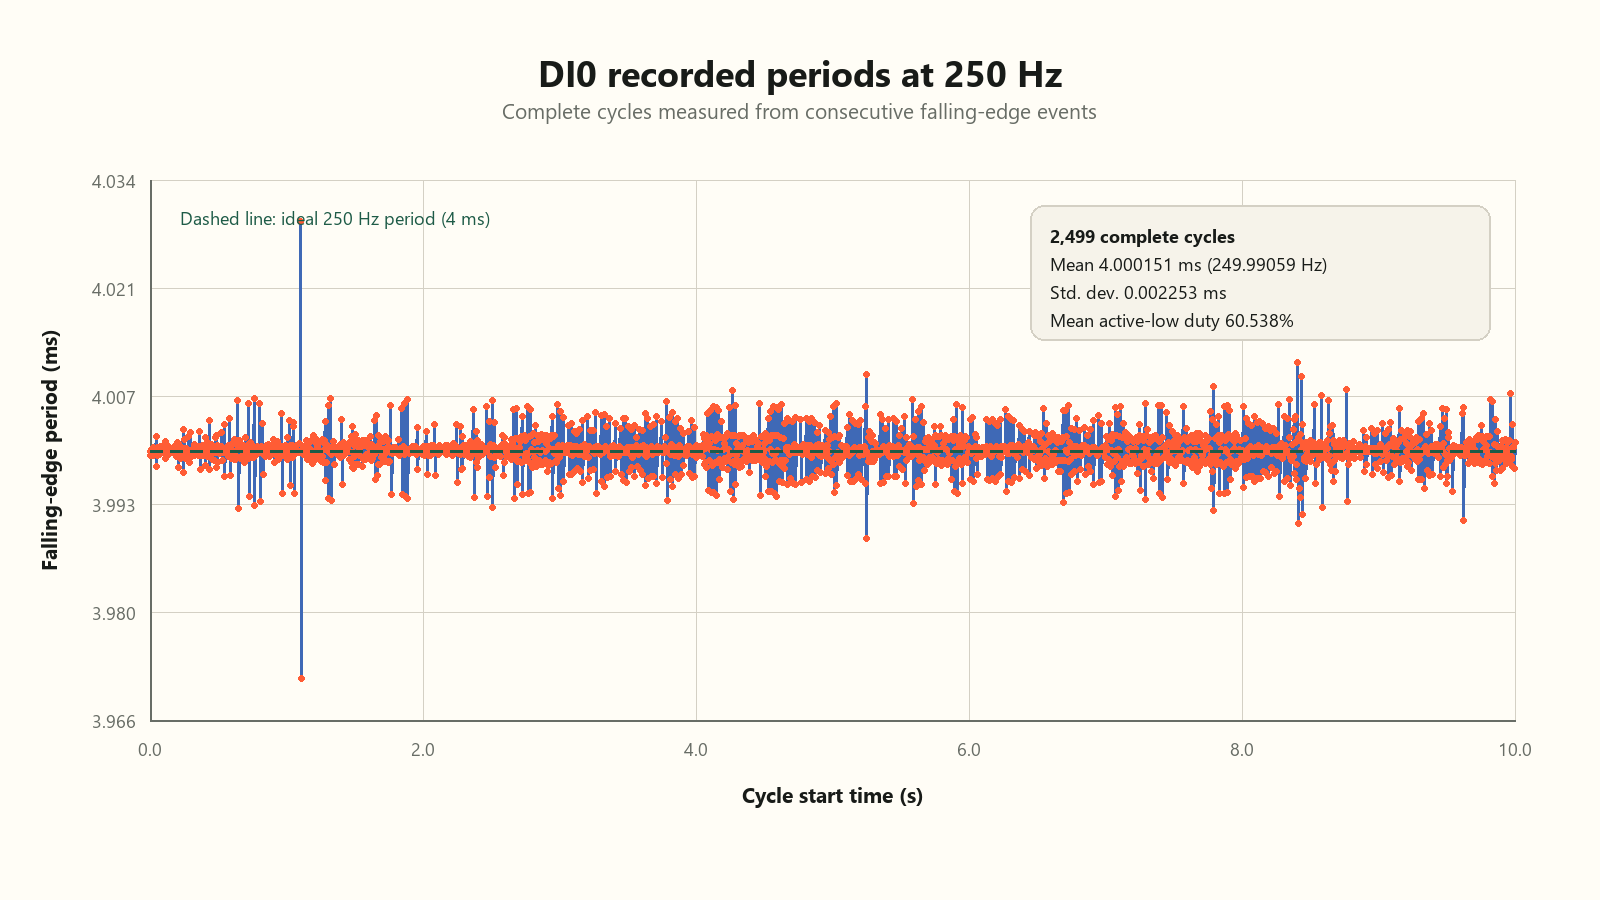
To check whether the generator itself was producing an asymmetric waveform, I measured the voltage directly at the DI0 terminal while W1 continued to drive the input. The oscilloscope reported 249.99 Hz, a 4.0001 ms period, and 50.004% positive duty cycle. Rise and fall times were 1.0576 µs and 1.3489 µs.
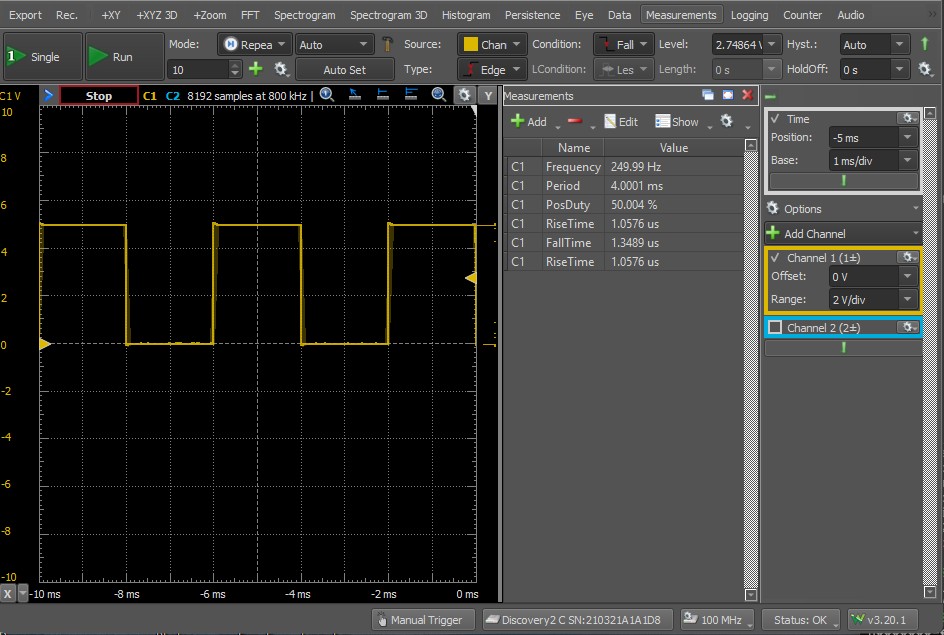
| 250 Hz comparison | Active interval |
|---|---|
| Ideal 50% signal | 2.000 ms |
| GPIO log at 60.54% | 2.422 ms |
| Difference | Approximately +0.422 ms |
With a period of approximately 4 ms, the logged 60.54% active-low duty cycle corresponds to an active interval of about 2.422 ms—roughly 422 µs longer than the 2.000 ms expected from an ideal 50% waveform. This is a difference in detected pulse duration, not an absolute propagation-delay measurement.
The difference may be related to input filtering, optocoupler behavior, or switching thresholds, although I could not determine the exact cause. I also limited testing to 5 V because I did not have the appropriate equipment for higher-voltage tests at the time. Testing at 12 V in the future could help me better understand this behavior.
Chapter summary
Digital I/O test observations
The DO0 experiments confirmed that the output could be controlled through Linux GPIO interfaces, with libgpiod providing substantially better switching accuracy than repeated pinctrl subprocess calls. The measurements also demonstrated how external pull-up resistance influenced the output’s electrical transitions, while software-generated switching exhibited occasional timing variations.
DI0 recorded the expected number of transitions at each tested frequency through 250 Hz. However, its detected active-low duty cycle increased with frequency despite the applied waveform remaining close to 50%. These results do not establish the input’s maximum switching frequency or identify the cause of the timing difference.
In the next chapter, I’ll test the ED-IPC1220’s analog inputs and examine its operating system.